How to Debug Mysterious Chrome Freezes
How to properly investigate when you encounter mysterious browser freezes.
Recently, a Chrome browser upgrade triggered a latent issue in a tracking SDK. The tracking SDK team has since followed up and resolved it. For details, see the article “The Freeze Issue on Qianfan Workbench Under Chrome 83.”
Everything seemed fine, but team members kept reporting that while the production pages were no longer freezing, certain operations in the test environment still caused freezes. Moreover, during freezes, golden or omega tracking requests were stuck in a pending state. And so the investigation began.
1. Following the Clues
Inspecting the pending requests:
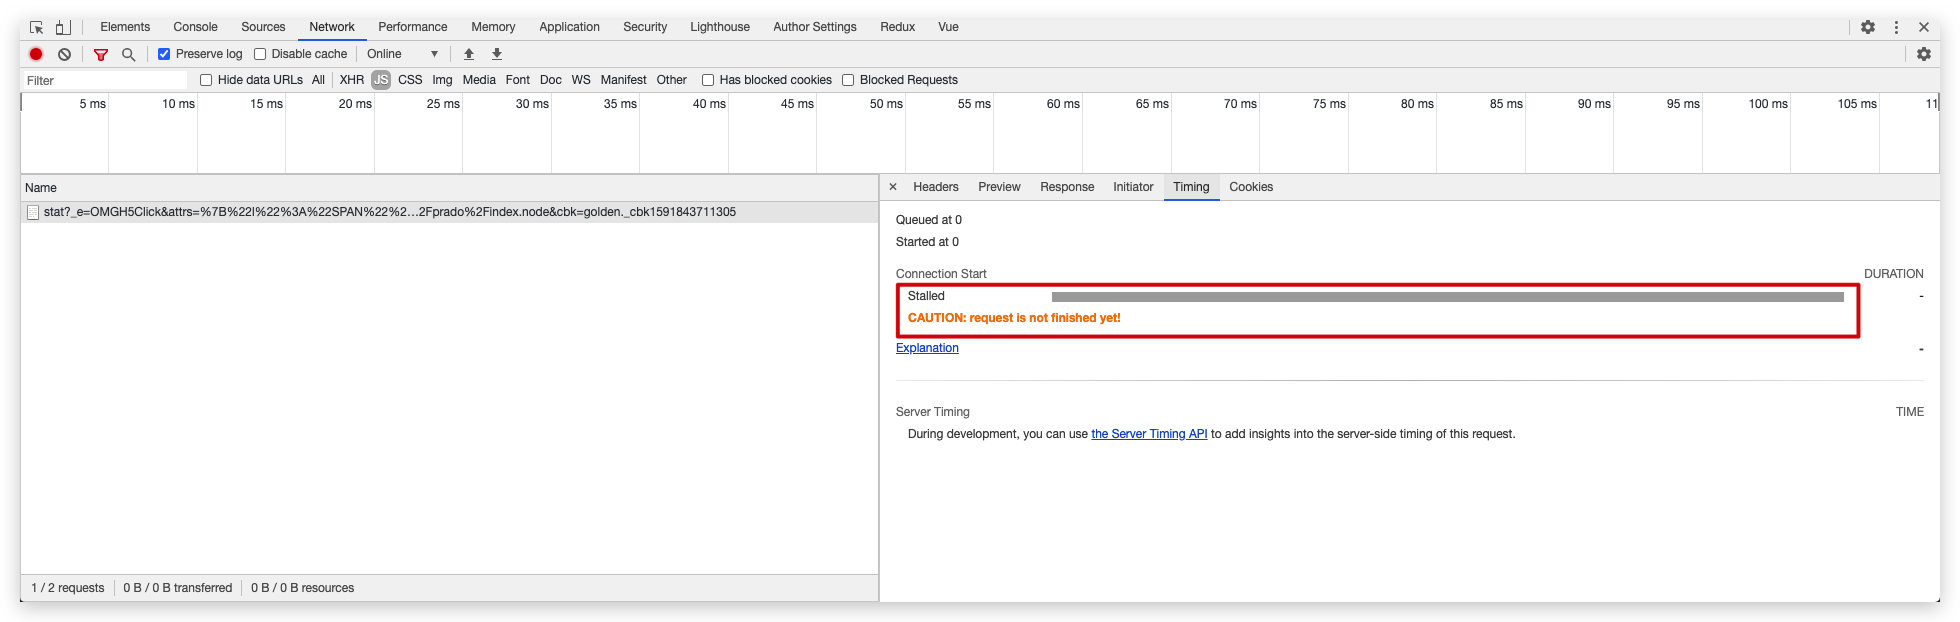
We found that the requests were stuck in a “Stalled” state. Google helpfully provided an “Explanation” link with the following details:
Here’s more information about each of the phases you may see in the Timing tab:
Queueing
. The browser queues requests when:
- There are higher priority requests.
- There are already six TCP connections open for this origin, which is the limit. Applies to HTTP/1.0 and HTTP/1.1 only.
- The browser is briefly allocating space in the disk cache
Stalled. The request could be stalled for any of the reasons described in Queueing.
DNS Lookup. The browser is resolving the request’s IP address.
Initial connection. The browser is establishing a connection, including TCP handshakes/retries and negotiating an SSL.
Proxy negotiation. The browser is negotiating the request with a proxy server.
Request sent. The request is being sent.
ServiceWorker Preparation. The browser is starting up the service worker.
Request to ServiceWorker. The request is being sent to the service worker.
Waiting (TTFB). The browser is waiting for the first byte of a response. TTFB stands for Time To First Byte. This timing includes 1 round trip of latency and the time the server took to prepare the response.
Content Download. The browser is receiving the response.
Receiving Push. The browser is receiving data for this response via HTTP/2 Server Push.
Reading Push. The browser is reading the local data previously received.
In other words, the issue during the Queueing phase caused the request to get stuck in the Stalled state. Through further research, we learned that you can view Chrome’s runtime logs (including detailed network logs) using the following method:
For instructions on viewing logs on different platforms, see https://support.google.com/chrome/a/answer/6271282?hl=en
Open the browser with logging enabled:
/Applications/Google\ Chrome.app/Contents/MacOS/Google\ Chrome --enable-logging --v=1Watch the logs in real time:
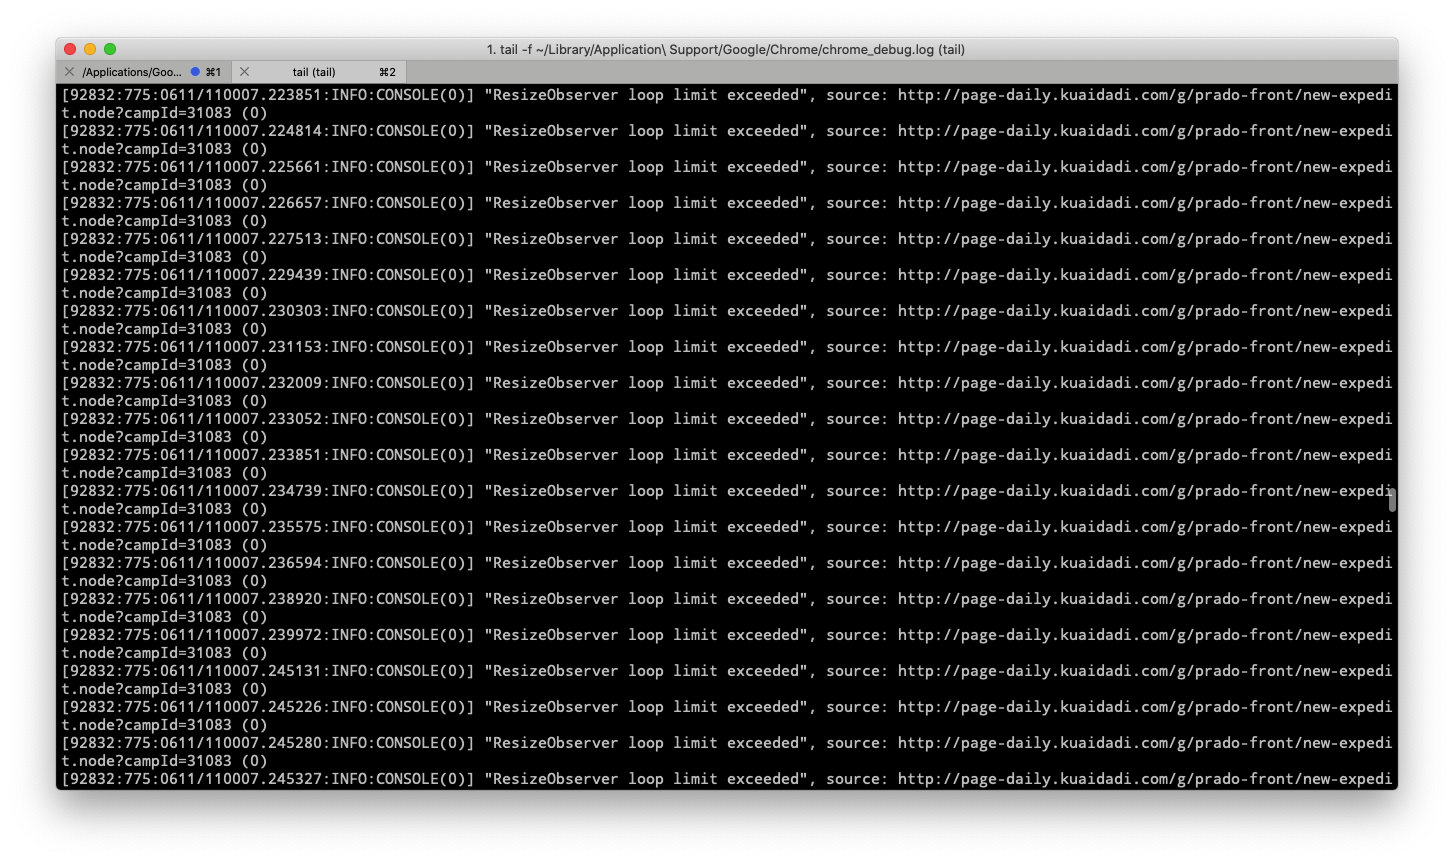
tail -f ~/Library/Application\ Support/Google/Chrome/chrome_debug.log
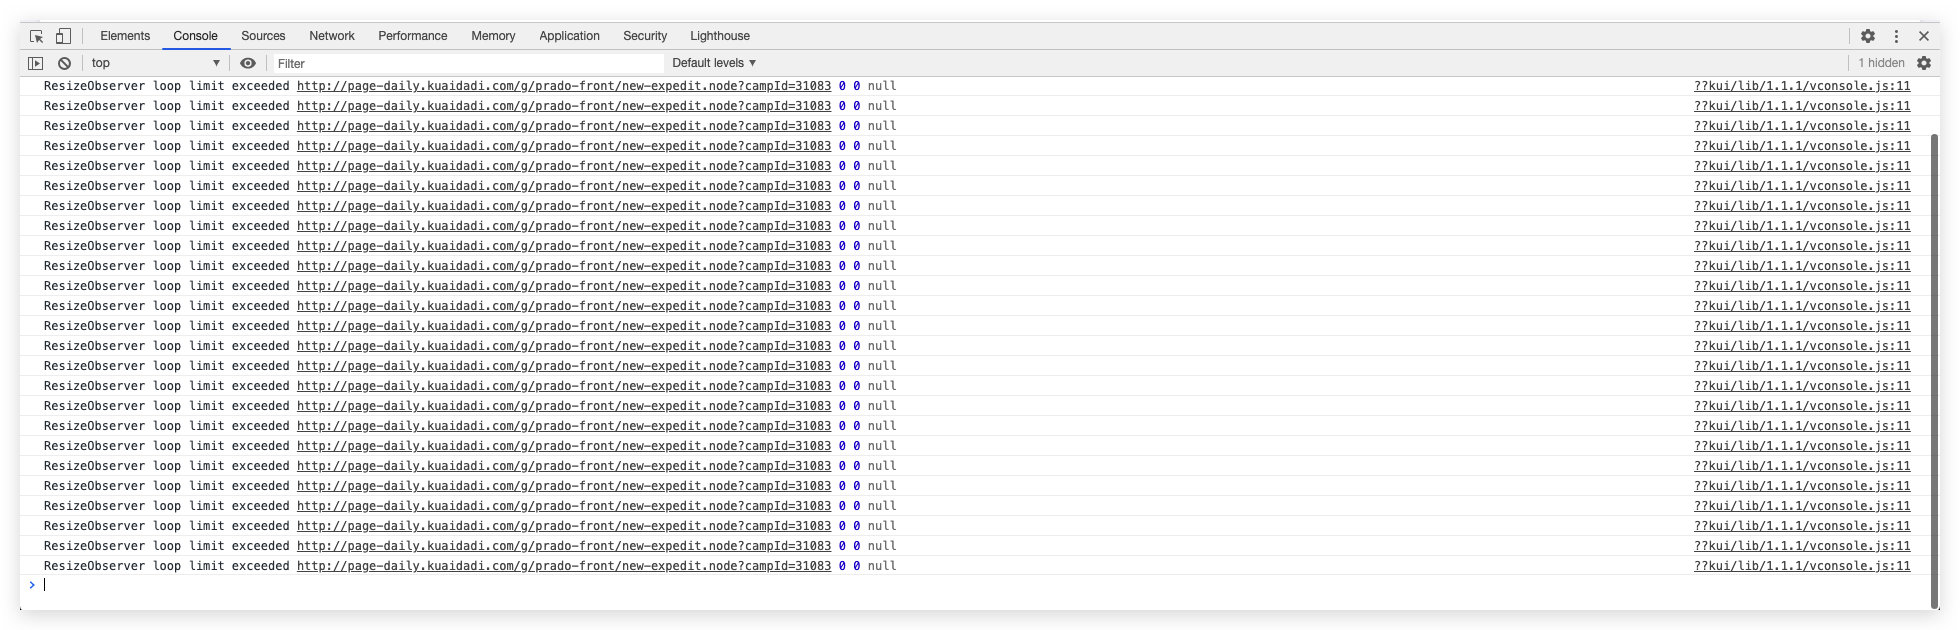
2. Examining the Logs
After opening the browser as described above and watching the log file in real time, we reproduced the issue step by step. The log output was as follows:
So after going in circles, it was still a “ResizeObserver” issue. The root cause was also mentioned in the article The Freeze Issue on Qianfan Workbench Under Chrome 83. Here are two related issues for those interested:
3. Hypothesis
So why does the test environment have the problem while production does not? The current fix for the Omega SDK and Golden SDK overrides EventTarget.prototype.addEventListener to filter out tracking requests (it was the infinite loop of tracking requests that caused the page to freeze):
1 | EventTarget.prototype.addEventListenerBase = EventTarget.prototype.addEventListener; |
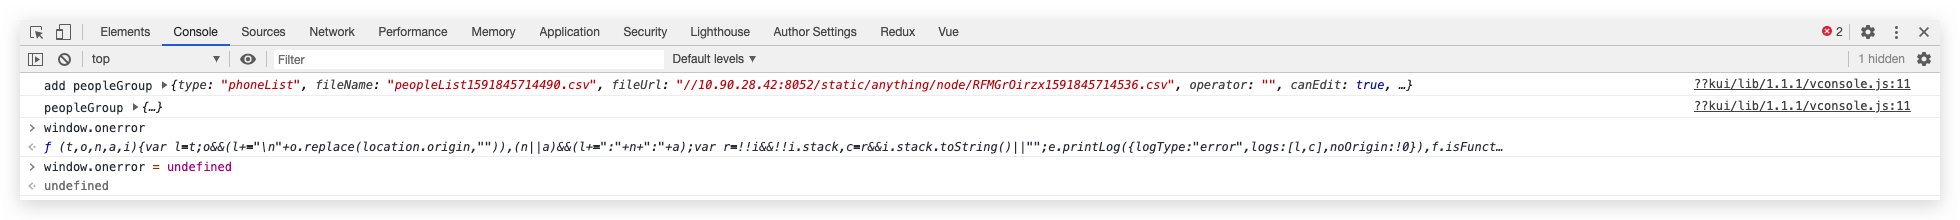
So there must be another listener beyond EventTarget.prototype.addEventListener that was not overridden. I had a hunch – could it be window.onerror? So I went to the debug console of the frozen page and printed window.onerror:
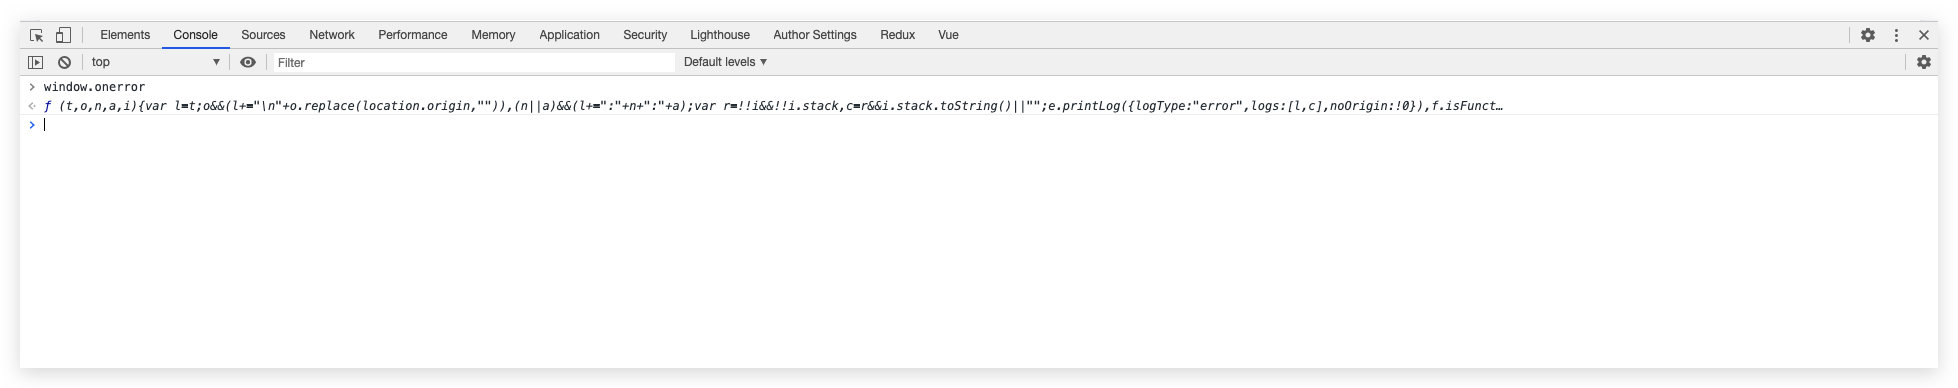
Indeed, there was a listener, and it even included a “string replace operation.” If this callback were invoked in an infinite loop, it would freeze the page in no time! I clicked on the printed result, which jumped directly to the code referencing it:
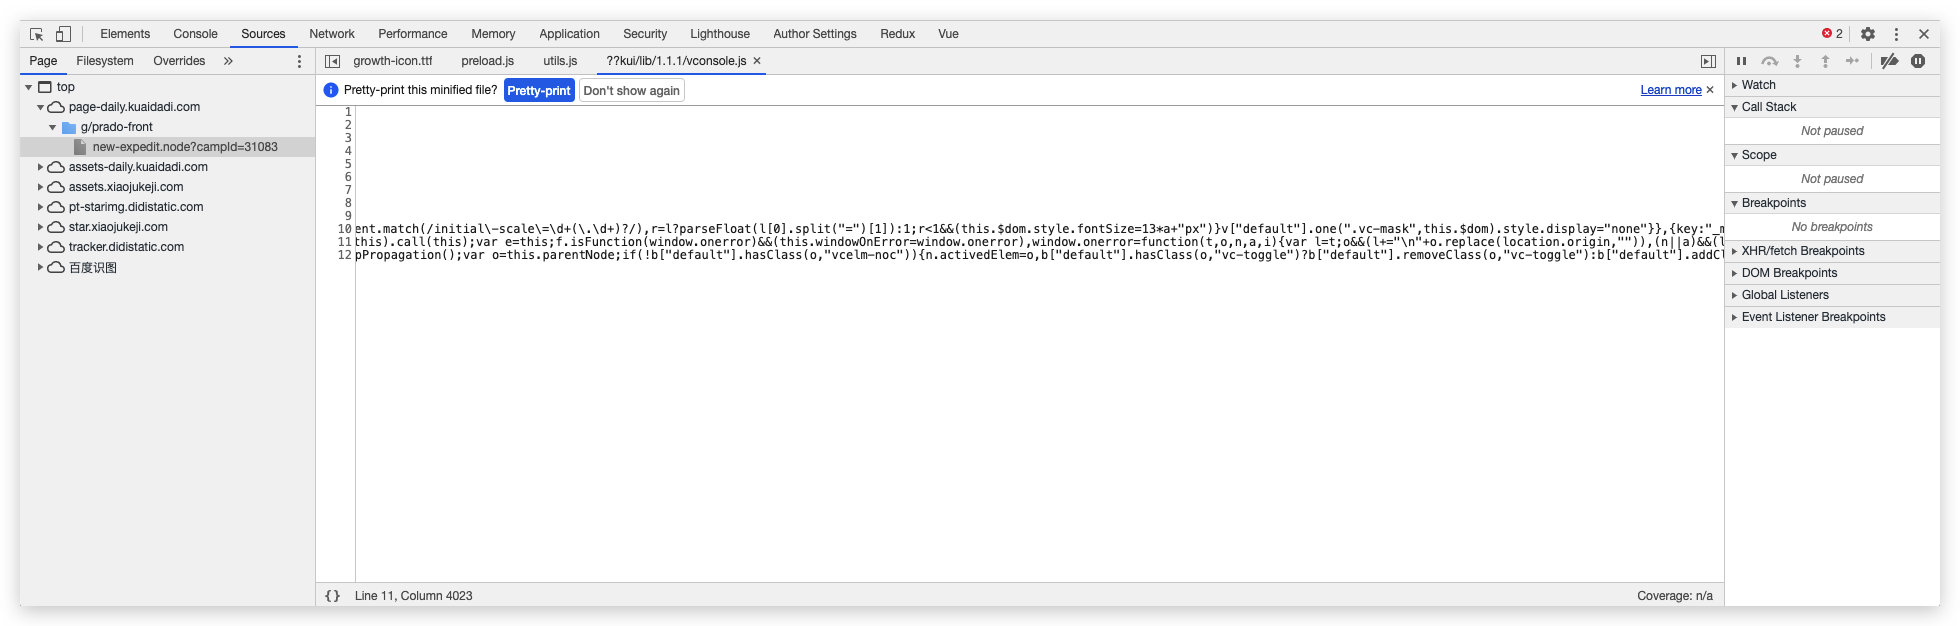
It turned out to be vConsole’s listener! As frontend developers know, vConsole is used for convenient debugging on mobile devices and is typically only enabled in the test environment. So this code was very likely the culprit causing freezes in the test environment while production worked fine!
4. Verification
Next, we verified the hypothesis. First, we overrode window.onerror with console.log, repeated the reproduction steps, and the console printed:
Sure enough – but it still froze because console.log is also a synchronous operation. Then we directly set window.onerror to undefined by running window.onerror = undefined, and tried again:
The page no longer froze!
5. Resolution
Until Chrome and ele-element address the issue, the available solutions are:
- Remove vConsole – after all, middle-platform projects don’t need vConsole;
- Set
window.onerrorto undefined; - Throttle
window.onerror;
6. Summary
To summarize, when encountering mysterious freezes, the debugging steps should be simplified to:
- Listen to the
window.onerrorevent – this allows you to print internal errors (those that don’t show up in the console) directly to the console - Open the browser with Chrome log monitoring enabled and look for clues in the logs
- Form reasonable hypotheses and verify them
How to Debug Mysterious Chrome Freezes
http://quanru.github.io/2020/06/11/How-to-Debug-Mysterious-Chrome-Freezes